Return to the main story, “9-Year-Olds Record Highest Scores Ever on Long-Term NAEP,” July 14, 2005.
Trends in average reading scale scores for students ages 9, 13, and 17: 1971–2004
* Significantly different from 2004.
SOURCE: U.S. Department of Education, Institute of Education Sciences, National Center for Education Statistics, National Assessment of Educational Progress (NAEP), selected years, 1971–2004 Long-Term Trend Reading Assessments

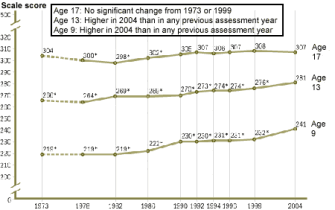
Trends in average mathematics scale scores for students ages 9, 13, and 17: 1973–2004
* Significantly different from 2004.
NOTE: Dashed lines represent extrapolated data.
SOURCE: U.S. Department of Education, Institute of Education Sciences, National Center for Education Statistics, National Assessment of Educational Progress (NAEP), selected years, 1973–2004 Long-Term Trend Mathematics Assessments